Help
Monitor
Monitor keeps an eye on your infrastructure so you know when things go wrong. It covers uptime monitoring, heartbeat checks, error tracking, log aggregation, and public status pages.
Uptime Checks
Create monitors that ping your URLs at regular intervals and alert you when they go down. The dashboard shows current status, response times, and uptime percentage for each monitor. You can trigger an immediate check from any monitor’s detail page.
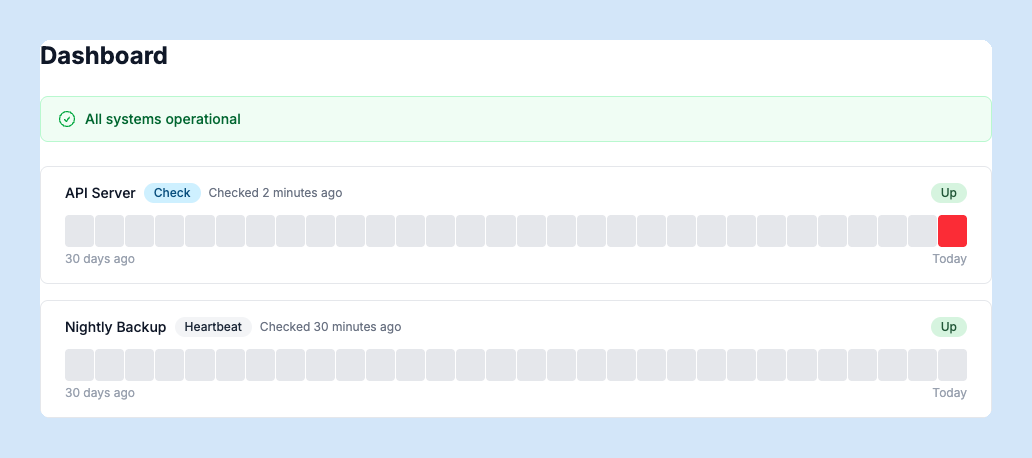
Heartbeats
For scheduled jobs and background tasks, use heartbeat monitors. Your job sends a POST to a unique heartbeat URL on each successful run. If SquirrelStack doesn’t receive a heartbeat within the expected interval, it flags the monitor as down.
Error Tracking
Track application errors automatically by connecting your app via the Airbrake-compatible API. Errors are grouped by type and message, so you can see how often each error occurs and when it was first and last seen. Mark errors as resolved, re-open them if they recur, or ignore them permanently.
Logs
The Logs section aggregates log entries from your application. Filter by level, source, or custom labels. Save frequently-used searches for quick access. The live tail view streams new log entries in real time.
Status Page
Every account gets a public status page at status.squirrelstack.app/your-slug that shows the current state of your monitors. Share it with your users so they can check service status without contacting support. The status page is always accessible, even if your own site is down.
Notifications
Configure alert notifications in Settings > Notifications. You can receive alerts via browser push notifications or Slack when a monitor goes down, an error is detected, or a heartbeat is missed.